
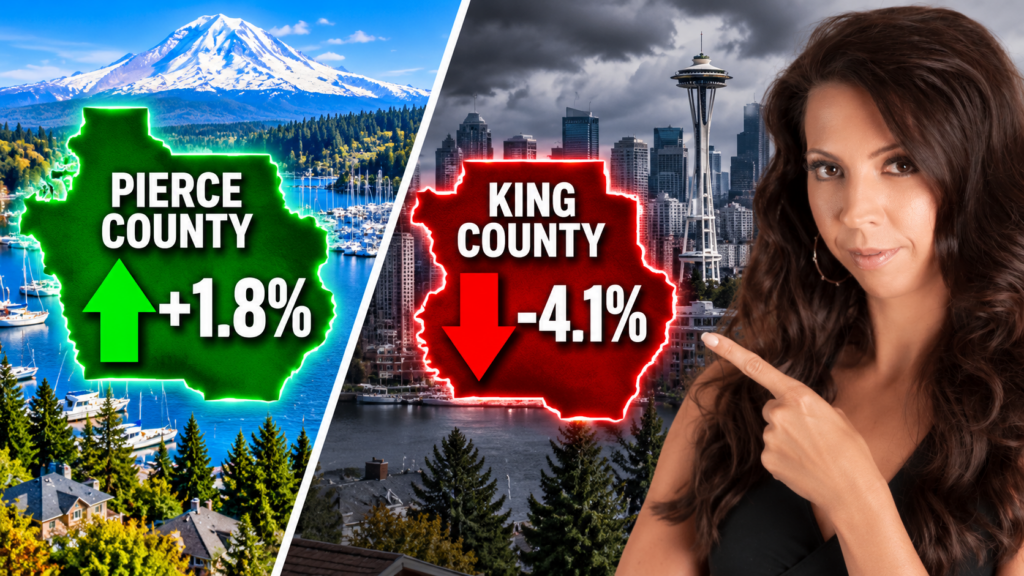
Western Washington housing headlines seem contradictory right now. One report suggests Seattle home values are slipping. Another shows Pierce County prices gaining. National data points to another month of annual price declines.
So, is the Western Washington housing market heading for a crash?
The short answer is no—the market is rebalancing, but it is also highly divided. Prices are rising in some counties and softening in others. At the same time, growing inventory is giving buyers more choices and greater negotiating power.
The most important takeaway is that there is no single “Western Washington market.” Your county, city, neighborhood, property type, condition, and price range all influence what your market looks like today.
Why the Housing Reports Seem to Disagree
Northwest MLS, Zillow, and Realtor.com may publish different numbers because they measure different geographic areas and use different methods.
Northwest MLS data can show activity across the broader regional market or within individual counties.
Zillow may focus on estimated typical home values within a particular city.
Realtor.com tracks national and regional listing trends.
All three sources can be accurate while describing very different parts of the market. A regional average may also conceal opposing trends—for example, price growth in one county and price declines in another.
That is why a broad headline cannot tell you what your home is worth or how much leverage you may have when making an offer.
Western Washington Home Prices Are Moving in Different Directions
According to the market data discussed in the September video, year-over-year median sold prices during the first week of September showed a clear county-by-county divide:
| County | Year-over-year change | Median sold price |
|---|---|---|
| Pierce County | Up approximately 1.8% | $575,000 |
| Thurston County | Up approximately 2.7% | $524,000 |
| King County | Down approximately 4.1% | $838,800 |
| Snohomish County | Down approximately 5.6% | $705,000 |
Days on market were relatively similar across the four counties—generally around 20 to 22 days. This suggests that the most notable difference was not simply how quickly homes were selling, but the direction in which prices were moving.
Regionally, the median price was close to flat. However, that number was an average of markets moving in opposite directions. For a homeowner in Gig Harbor or elsewhere in Pierce County, a Seattle-wide or statewide headline may not reflect current local comparable sales.
Inventory Is Creating More Opportunity for Buyers
The larger shift is happening in available inventory. Based on the August 2026 Northwest MLS figures featured in the video:
Residential inventory increased approximately 21.4% year over year.
Residential months of supply reached about 4.3 months, up nearly 23%.
Condo months of supply rose to approximately 5.9 months, an increase of more than 37%.
New listings increased about 12.2% for residential homes and 22.4% for condos.
Closed sales declined approximately 12.4% for homes and 16.5% for condos.
In practical terms, more properties are entering the market while fewer are closing at the same pace. Buyers therefore have more homes to compare and may have room to request terms such as closing-cost assistance, repair credits, inspection protections, or a mortgage-rate buydown.
This does not mean every buyer can negotiate aggressively on every listing. Well-priced, well-presented homes can still attract quick interest. Buyers should remain fully prepared and pre-approved so they can act promptly when the right property becomes available.
Seattle Is a Split Market Within a Split Region
Seattle provides a useful example of why averages require context. The Zillow data referenced in the video showed a typical Seattle home value of approximately $851,471, down about 1.8% year over year. Yet the median home was still going pending in roughly 14 days, and the average sale-to-list ratio was close to 100%.
The same data showed that approximately 34.5% of homes sold above list price, while about 39.4% sold below list price.
Those results point to two different experiences occurring within the same city:
Homes aligned with current buyer expectations can still sell quickly and may receive competing offers.
Listings priced too aggressively—or those that compare poorly with available alternatives—may sit longer and require a price adjustment.
For sellers, presentation and pricing are increasingly important. For buyers, the citywide decline does not automatically mean that every home offers the same negotiating opportunity.
Does the National Market Point to a Crash?
The national figures discussed in the video showed an August median list price of approximately $424,500, down about 1.3% year over year. Although this represented the tenth consecutive month of annual declines, the pace of decline had slowed from July.
National active listings were up, but total inventory remained below pre-pandemic norms. Roughly one in five active listings had experienced a price reduction. In the Western region—which includes Washington—the median list price was approximately $599,000, down around 2.1%, with about 22% of listings showing a price cut.
These figures are more consistent with a market correction and normalization than a sudden housing crash. Inventory is recovering from historically low levels, buyers are becoming more selective, and sellers must compete more carefully on price and condition.
Mortgage rates also remain an important part of the picture. The video noted that 30-year mortgage rates were in the high-6% range around late August and early September. Buyers waiting for rates near 5% should weigh the uncertainty of future rate movements against the negotiating opportunities available today. Loan programs, rates, and qualification requirements vary, so buyers should consult a qualified lender for advice based on their circumstances.
What Buyers Should Do Now
Buyers have more leverage than they have had in recent years, especially in locations and property segments where inventory has increased and prices have softened.
Consider the following approach:
Obtain a current pre-approval before beginning serious negotiations.
Review recent comparable sales and the listing’s full market history.
Evaluate how long the property has been available and whether its price has changed.
Ask your agent whether a rate buydown, closing-cost credit, repair request, or other protective term is reasonable.
Move decisively when a well-priced home meets your goals, because desirable listings can still sell quickly.
What Sellers Should Do Now
Today’s buyers have more alternatives, so pricing a home based on a neighbor’s sale from last year can be risky.
Sellers should:
Base the asking price on the most recent comparable sales and active competition.
Prepare the property carefully so it compares favorably online and in person.
Review activity during the first days and weeks on the market.
Respond to showing feedback and changes in competing inventory.
Use a neighborhood-level strategy rather than relying on a countywide or national average.
Condo sellers may face particularly strong competition, given the higher months of supply discussed in the video. Accurate pricing, condition, photography, and marketing can materially affect how buyers respond.
What Investors Should Watch
A divided market can create opportunities for investors who evaluate each property individually. Rising for-sale inventory, selective buyers, and steady rental demand may produce value-add opportunities in certain locations.
However, an investment should be evaluated using realistic acquisition costs, financing terms, renovation expenses, reserves, taxes, insurance, rental assumptions, and exit strategies. The possibility of refinancing later should never replace sound analysis based on the loan and cash flow available today.
The Bottom Line: Rebalancing, Not a Uniform Crash
The September 2026 data does not show one uniform Western Washington housing market:
Pierce and Thurston counties were still posting year-over-year price gains.
King and Snohomish counties showed price softness.
Inventory increased by more than 20% regionally, creating more buyer choice.
Seattle remained divided between competitive, well-positioned listings and homes selling below their original expectations.
National and regional price trends pointed toward normalization rather than a sudden market collapse.
Whether you are buying, selling, or investing, the right decision starts with current, property-specific information—not a national headline.
Get a Local Market Analysis
Wondering whether your neighborhood currently favors buyers or sellers? I can prepare a local review using recent comparable sales, active competition, inventory, and buyer activity surrounding your property or target area.
Contact Lianne Hall, Realtor®, for a personalized Western Washington market analysis or a copy of the free seller’s guide. Whether you are planning a move now or simply monitoring your equity, local data can help you make a more informed decision.
Market figures are based on the data cited in the accompanying September 2026 video and may change as new reports are released. Information is provided for general educational purposes and is not financial, legal, tax, appraisal, or lending advice. Equal Housing Opportunity.